I was lucky enough to present at FARCON with a coworker and former client at the University of Minnesota on 8/23. It was pretty cool to present with both a co-worker and client, and a career highlight. See below for the presentation.
Read MoreI was lucky enough to present at FARCON with a coworker and former client at the University of Minnesota on 8/23. It was pretty cool to present with both a co-worker and client, and a career highlight. See below for the presentation.
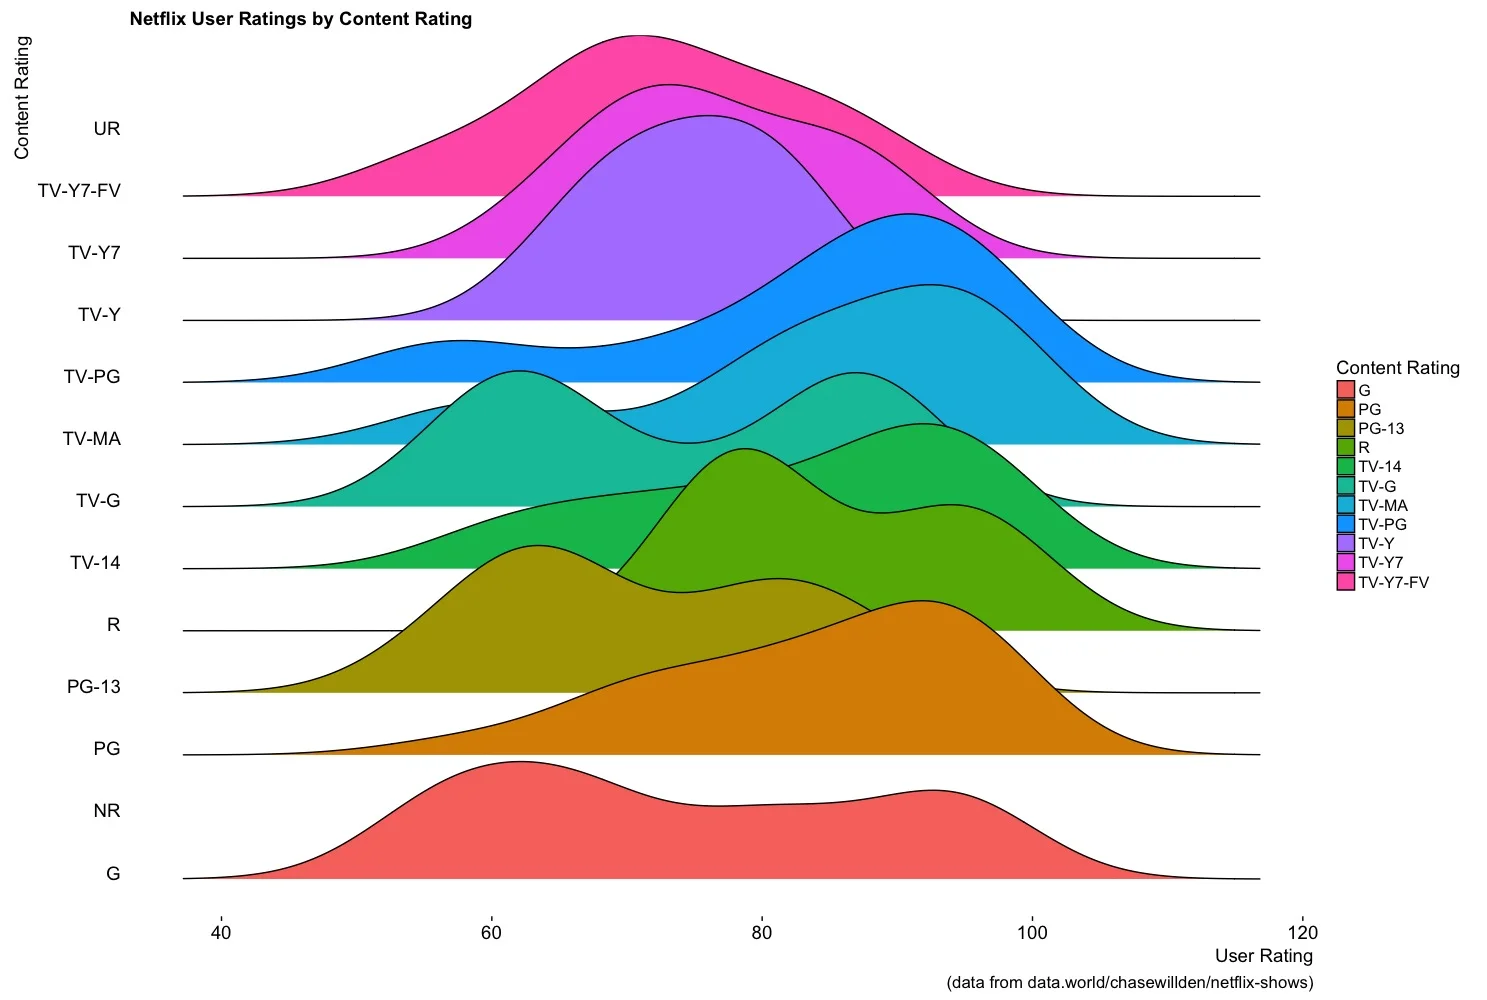
Read MoreAt work, a lot of questions revolve around "how has x changed over time" or "how is x different segmented by y". I'm always struggling to give a concise and truthful answer while also showing context. By providing one number (x has changed by this % relative to the same period last year), you are removing context in order to drive a decision through simplicity. With visualization it is possible to both show a summarized concise answer, while also providing context. Joyplots are another tool to illustrate context through visualization.
Read MoreI came across an awesome data set on data.world (https://data.world/jasonmotylinski/89-3-the-current-playlists) where Jason Motylinksi scraped every song played on 89.3 the Current since 2012 through the end of 2016.
If you want to see the interactive version where you can filter by year and artist - here it is:
https://public.tableau.com/profile/pragerd#!/vizhome/AnalyzingTheCurrent89_3/DashtoDate
Read MorePost election there has been no shortage of postmortems and analysis (So here is another one?). Many of these analyses have focused around the narrative of Hilary "ignoring" the white working class and economically depressed rural areas, while assuming that large urban areas would carry enough electoral weight to give her the presidency.
Let's look at a couple of the narratives and see if census data can help explain shifts.
Read MoreWhile watching the opening ceremonies, during the parade of nations, I noticed that population data and the number of olympians was provided for each nation. This made me curious. Which nations have more olympians relative to their population? Beyond population, how do nations compare in the number of olympians they send and the number of medals they win?
Click through to explore the data!
Read MoreBetween 2013 and 2015 nearly 700,000 Syrians have sought asylum (UNHCR). In that time period the United States has accepted hundreds of asylum seekers while Germany has accepted over 145,000. Sweden has accepted over 84,000.
I was curious about the scale, scope and path of asylum seekers around the world, especially in the last few years.
I downloaded data from the UNHCR website (http://popstats.unhcr.org/en/overview) and using Tableau did some visualization to better understand the data. I chose the dataset for "asylum seekers" as there was recent data, but if you look at "persons of concern" data the numbers are even starker (http://popstats.unhcr.org/en/persons_of_concern) . Here is a link to donate to the UNHCR - https://donate.unhcr.org/us-en/redirect
Read MoreAt work recently I've been using Facebook Ad Planner data as a way to get a high level understanding of audiences. The Facebook Ad Planner data let's you see the potential size of audiences defined as many ways as you would like.
I though it might be interesting to compare 2016 political candidates this way. It took some time to compile all the data (yes, it was manually entry into excel and yes it was pain), but the comparisons shed some light onto different candidates and their audience bases.
Read MoreI'm excited about the possibility for this stadium. The stadium will be privately funded, with an ownership group led by Bill McGuire, putting up the 250 million dollars to build the stadium.
On Friday, my Wife Emily and I met our friend Will for drinks at Tattersall distilling in Minneapolis. As a side note, you should really go there. While we were there Will wondered if the Twin Cities metro was large enough to support yet another professional sports team.
Read More
This all started reading the "Miracle of Minneapolis" article in the Atlantic.
That article argued that part of the success of Minneapolis lies in both its progressive tax policies and headquarters culture.
Read More
A couple of weeks ago, I stumbled on a neat blog - "Think to Start". On think to Start he has a number of tutorials with R. The tutorials have clear business applications, so I decided to try a few out.
When playing around with the Facebook Open Graph API, I realized that you could pull out data for posts from any public Facebook page. With each post, you also get dimensions like time posted, day of the week and the number of likes, comments, and shares.
With this API I was able to capture this data for 1,338 updates from the official NFL Facebook page (Facebook.com/NFL), from 10/24/12 to 12/04/14.
Read Morehe 2014 NFL season is now upon us. If you're any kind of an NFL fan at all, you've heard lots and lots of talk about the 2013 season, what happened and why.
This got me thinking about the types of data we have on these cities / metropolitan areas / states where our favorite NFL teams play and if we can learn anything about team performance or value based on how these communities differ on a variety of measures.
Would metropolitan wealth, size, inequality, well being, or "hipsterness" correlate, or even potentially explain, NFL franchise outcomes of success, specifically market valuation, 2013 performance relative to other teams (measured by DVOA) or playoff appearances since 1999?
Read MoreI'm a firm believer that you are what you measure. To combat the complexity of life we search for indicators that help us make improved decisions.
Constantly we are looking for reinforcement that we are winning or losing. There is incredible power in framing the indicators of winning and losing.
Uncovering true indicators of winning and losing assumes objective and quantifiable measures of performance that are accurate, reliable and replicable.
In our current networked world more behavioral data is tracked than ever before we have created new indicators in all realms of society - from academia to sports. Regardless of how you feel about "sabermetric" everything, the opportunities and implication for business are pretty astounding.
I'm all for creating schemas based on complex indicators to help us understand the world and make decisions based on data rather than limited experiences or focus groups of 1.
Read More